
RPE Calculator & Chart – RPE/RIR to % of 1RM
Estimate how hard a set was and what it suggests about your maximum. This tool uses a transparent Epley-plus-RIR model, with a chart for the rep count you enter.
Your numbers, your next step.
Slide or enter a value to update the result.
RPE-adjusted estimated max
98.7kg
2 reps in reserve · 81.1% of estimated max. Simplified Epley + RIR model; subjective effort can change the estimate substantially.
| RPE | RIR | % e1RM at these reps | Load for 5 reps |
|---|---|---|---|
| 6 | 4 | 76.9% | 75 kg |
| 7 | 3 | 78.9% | 77.5 kg |
| 8 | 2 | 81.1% | 80 kg |
| 9 | 1 | 83.3% | 80 kg |
| 10 | 0 | 85.7% | 82.5 kg |
Free, no signup. Inputs stay in your browser; they are not sent to Trainer.
Every lift, tracked.
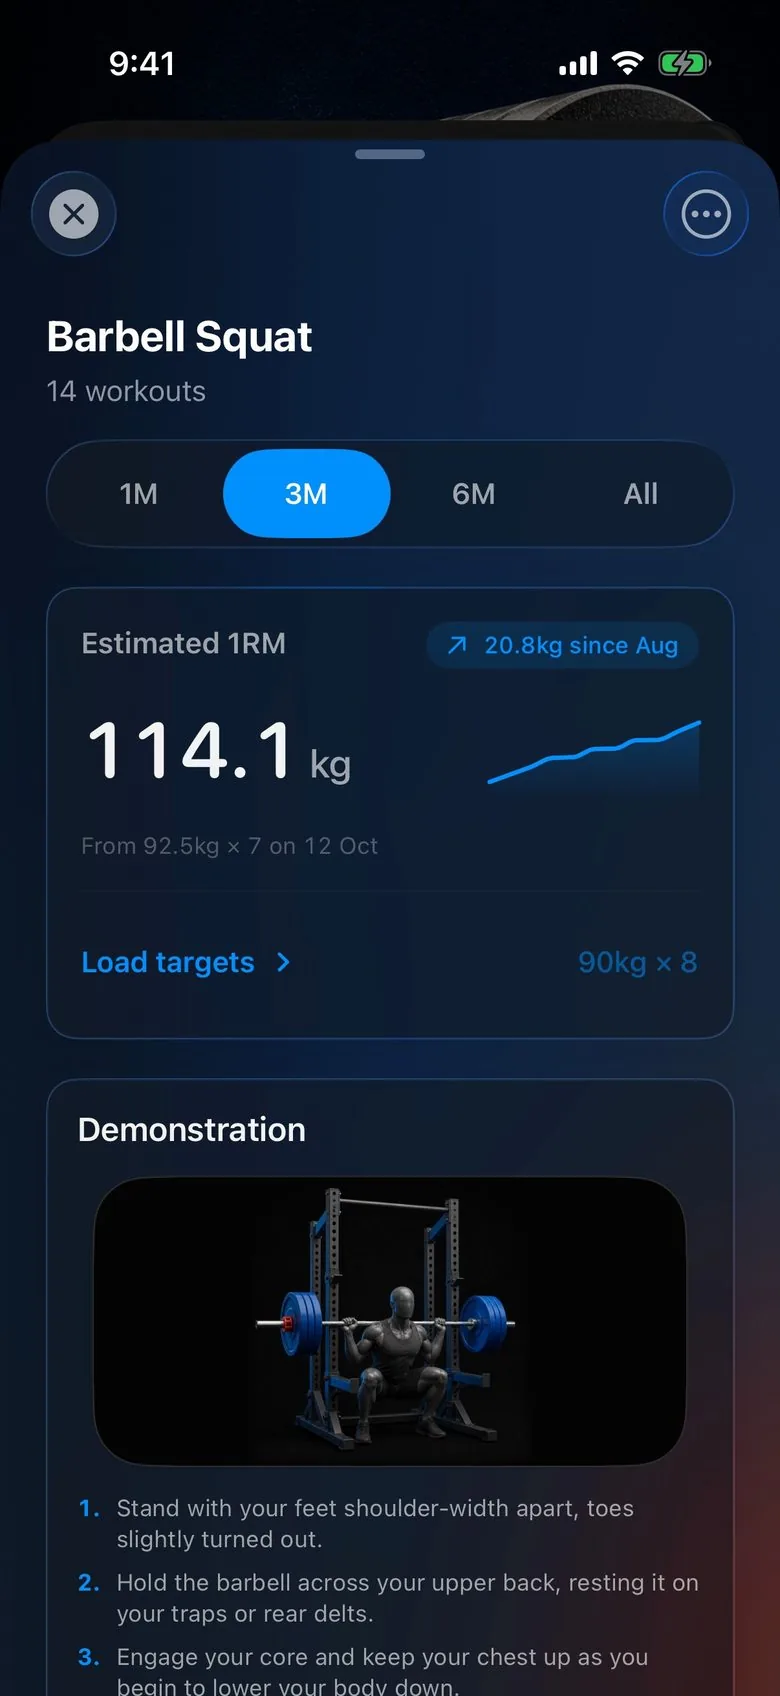
Trainer works out your estimated max from the sets you log, for every lift, and shows how far it has moved.
Get the appTranslate RPE into reps in reserve
Rate the effort of the completed set, not how tired you feel across the whole workout. On the lifting scale used here, RPE ten means no additional clean repetitions were available. RPE nine means about one remaining repetition; RPE eight means about two. The simple conversion is reps in reserve, or RIR, equal to ten minus RPE.
Enter the weight, completed reps, and your effort estimate. The tool accepts RPE six to ten in half-point steps. Half points allow an in-between judgment, but they are not a precise measurement of physiology. Especially when you are new, treat your rating as an estimate you can improve through experience.
The estimated-max formula
This calculator adds RIR to completed repetitions to model a hypothetical set taken to failure. It then applies an Epley-style estimate: load multiplied by one plus effective reps divided by thirty. For a single repetition at RPE ten, the result is the actual lifted load. A single at a lower effort is modeled as a submaximal performance.
The percentage chart divides your set weight by this modeled maximum. It is generated from the same equation, not copied from a validated individual profile or a proprietary coaching chart. The label matters: this is a transparent, simplified model. It can help you compare similar sets but does not prove the exact load you could lift once.
| RPE | Approximate RIR | What the rating means |
|---|---|---|
| 10 | 0 | No clean repetition left |
| 9 | 1 | About one clean repetition left |
| 8 | 2 | About two clean repetitions left |
| 7 | 3 | About three clean repetitions left |
| 6 | 4 | About four clean repetitions left |
A worked example
An 80 kg set of five at RPE eight has about two repetitions in reserve. The model therefore uses seven effective reps and returns roughly 98.7 kg. The same set rated at RPE ten uses five effective reps and returns roughly 93.3 kg. That difference comes entirely from your subjective rating, which is why the output should not be treated as exact.
Use the one-rep max calculator if you want to compare Epley, Brzycki, and Lombardi using completed repetitions alone. Those models also have limitations. Adding an effort rating supplies context, but it does not remove uncertainty from the underlying repetition-to-load relationship.
Rate clean repetitions, not any possible movement
Imagine another repetition using the same range of motion and technique. A rep you could complete only by bouncing, cutting depth, or changing the exercise does not count as a clean reserve rep. Distinguish muscular effort from pain, dizziness, or equipment discomfort. Stop and address those problems rather than turning them into an RPE score.
For beginners, exact failure prediction can be difficult. You can still learn useful distinctions: easy, moderately hard, and close to your limit. Record the number honestly, or leave it unrecorded when you do not know. Inventing a tidy effort score makes the log look complete while making future comparisons less reliable.
Use the result to guide the next set
Compare the performance with your planned effort. If a set intended around RPE eight felt like a clear ten, repeating or reducing the load may be more sensible than following a scheduled increase. If it was comfortably easier, you may have room for another controlled rep or a modest load increase. Technique and the overall session still govern the choice.
The progressive overload calculator gives an example progression that only applies when sets succeed. The guide to RPE and RIR explains how to practice ratings. The guide to deload weeks explains why repeated high effort with declining performance deserves a broader review.
Keep predictions comparable
Use the same exercise, rep range, technique, and effort convention when looking at estimated-max trends. An inflated RPE-adjusted maximum from a very easy set is weak evidence. Several repeatable hard sets provide a clearer picture. The useful outcome is better training decisions, not a larger predicted number that never appears in your actual sessions.
Frequently asked questions
Is this the official RTS RPE percentage chart?
No. It uses a simplified Epley + RIR equation and generates its own percentage chart. The model and its limits are stated so you can interpret it correctly.
What does RPE eight mean?
On this lifting scale it means roughly two more clean repetitions were available. It is an effort estimate for that set, not a rating of your whole day.
What if I do not know my RPE?
Do not invent it. Use completed weight and reps for your log, and practice distinguishing easy sets from near-limit sets before relying on precise ratings.
Keep building your plan
- 1 Rep Max Calculator – One Rep Max Calculator & Chart
- Progressive Overload Calculator: Next Weight and Reps
- Workout Log Template: Printable and CSV Journal
- RPE vs RIR: Reps in Reserve Explained
- Deload Week: When and How to Deload
- Compare apps that track and progress your next set
- Choose a repeatable exercise and check the setup