
RPE Chart: Reps in Reserve and % of 1RM
Use the interactive RPE chart to compare effort levels at a chosen rep count. The percentages come from a transparent Epley-plus-RIR model, not a tested personal profile.
Your numbers, your next step.
Slide or enter a value to update the result.
RPE-adjusted estimated max
98.7kg
2 reps in reserve · 81.1% of estimated max. Simplified Epley + RIR model; subjective effort can change the estimate substantially.
| RPE | RIR | % e1RM at these reps | Load for 5 reps |
|---|---|---|---|
| 6 | 4 | 76.9% | 75 kg |
| 7 | 3 | 78.9% | 77.5 kg |
| 8 | 2 | 81.1% | 80 kg |
| 9 | 1 | 83.3% | 80 kg |
| 10 | 0 | 85.7% | 82.5 kg |
Free, no signup. Inputs stay in your browser; they are not sent to Trainer.
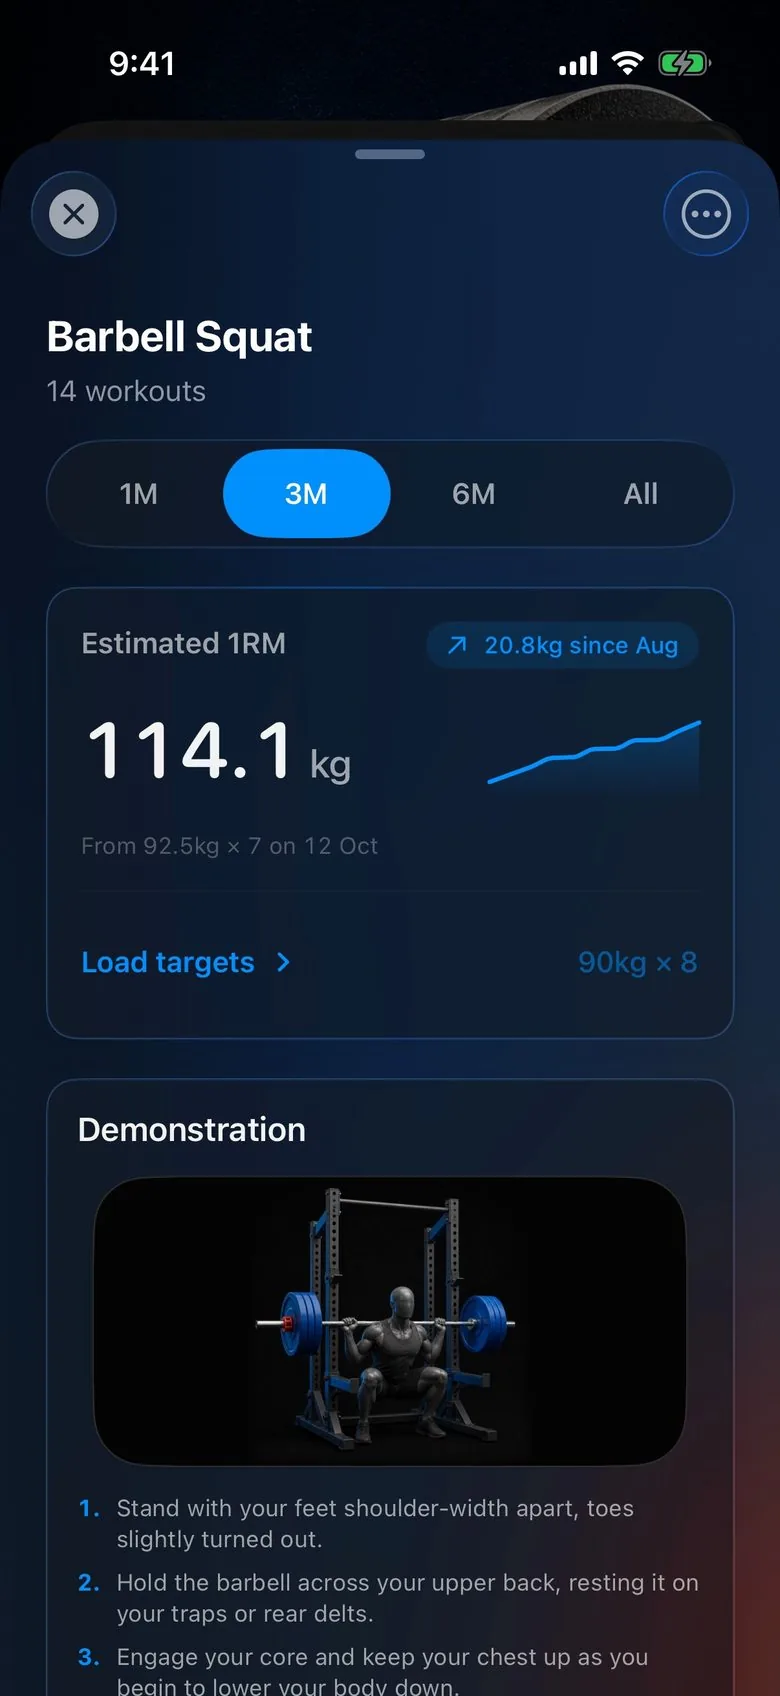
Every lift, tracked.
Trainer works out your estimated max from the sets you log, for every lift, and shows how far it has moved.
Get the appRead the RPE chart from the completed set
RPE describes the effort of a set. Reps in reserve describe how many additional clean repetitions you believe remained. On the lifting scale used here, subtract RPE from ten to get approximate RIR. A rating of eight means about two clean reps remained; ten means none remained under the same technique standard.
Enter completed reps to update the percentage chart. Enter the load and observed effort to see an estimated maximum. The chart is a model reference, not a requirement to attempt that maximum. If you do not know the effort rating, keep it uncertain in your real training log rather than inventing a number.
RPE, RIR, and clean repetitions
A clean reserve rep uses the same intended range of motion and technique. A rep available only by bouncing, cutting depth, or changing the movement should not quietly count as equivalent reserve. Pain, dizziness, or unstable equipment are separate problems that a rating cannot resolve.
| RPE | Approximate RIR | Set description |
|---|---|---|
| 10 | 0 | No clean rep left |
| 9 | 1 | About one clean rep left |
| 8 | 2 | About two clean reps left |
| 7 | 3 | About three clean reps left |
| 6 | 4 | About four clean reps left |
Half-point ratings describe an in-between judgment. They are not proof that you measured a fraction of a repetition precisely. Begin with broad distinctions and use repeated familiar exercises to make your ratings more consistent.
How the percentage chart is calculated
The model adds RIR to completed reps and uses an Epley-style estimate: load times one plus effective reps divided by thirty. It then divides the original load by the estimated max to get the percentage. A single rep at RPE ten returns its actual load as the estimate.
For five reps at RPE eight, effective reps are seven, so the entered load is about 81.1 percent of the modeled maximum. At RPE ten, five effective reps put it near 85.7 percent. Those percentages follow the equation; they are not a measured universal relationship for every lift and person.
Use the chart to check a decision
If your plan called for roughly two reserve reps and the set clearly reached a limit, repeat or reduce the load rather than forcing the next target. If it was substantially easier, another controlled rep or a modest increase may fit. The actual exercise, equipment increment, and session context still govern the choice.
The RPE calculator focuses on the same estimated-max calculation. The one-rep max calculator compares models using completed reps alone. Use the different tools to understand assumptions, not to select whichever prediction looks largest.
Keep the effort record honest
A tired day can contain an easy set, and an energetic day can contain a hard one. Rate the completed movement rather than your overall mood. Record meaningful changes in exercise order, rest, or equipment so later comparisons remain understandable.
The guide to RPE vs RIR explains practice and uncertainty. The guide to progressive overload shows how suitable effort can join an all-sets increase condition. Reaching the rep target through uncontrolled grinding is different from reaching it with the intended reserve.
Compare similar sets across a block
Use a consistent movement definition and a similar rep range. An unfamiliar machine and a barbell lift should not share one estimated-max line simply because both train the same broad muscle group. A long set limited by breathing is also different evidence from a familiar heavy set.
Look at several comparable exposures. More reps at a similar effort, steadier later sets, and consistent technique can all be useful observations. An isolated percentage shift based on a subjective rating deserves less confidence than a stable pattern in the original loads and reps.
Keep the chart in its proper role
The chart makes a coaching convention visible and translates a declared assumption into arithmetic. It cannot observe technique, verify the effort estimate, diagnose fatigue, or establish safe maximum loading. Use it to reduce confusion around a planned set while preserving the real record and the uncertainty that record contains.
Frequently asked questions
Is this an official proprietary RPE chart?
No. Its percentages are generated from a simplified Epley + RIR model. The equation and its limitations are visible on the page.
Why do percentages change when I change reps?
The model relates completed reps plus reserve reps to an estimated maximum. A different rep count changes that modeled relationship.
Can I judge RIR from heart rate?
Heart rate and reserve reps describe different information. RIR requires a judgment about additional clean repetitions in that specific set.